
Strong Underwriting, Weak Capital Efficiency: A Deep Dive into Ireland’s Captive Sector
Captive insurance remains a powerful strategic tool for large corporates seeking tighter control of risk, clearer visibility of group exposures, and a greater share of underwriting profit. Ireland has established itself as one of Europe’s most credible domiciles, supported by robust regulation, strong actuarial capability, and a diverse base of multinational captive owners.
The sector continues to deliver healthy insurance results. Premium volumes remain resilient, underwriting margins are consistently positive, and captives provide meaningful financial and risk-management value to their parent groups.
Yet beneath this strong headline performance lies a structural weakness that receives far less attention than it should: Irish captives underwrite well, but their capital works far too hard for the returns it delivers.
Between 2017 and 2024, the average Irish captive generated a return on capital of just 7.2%, less than half the 16.3% achieved by traditional non-life insurers. This shortfall is not driven by underwriting results — which are broadly comparable — but by persistent inefficiencies in how capital is structured and deployed. This article explores where those inefficiencies arise and how captives can unlock materially higher returns without increasing underwriting risk.
The Irish Captive Landscape
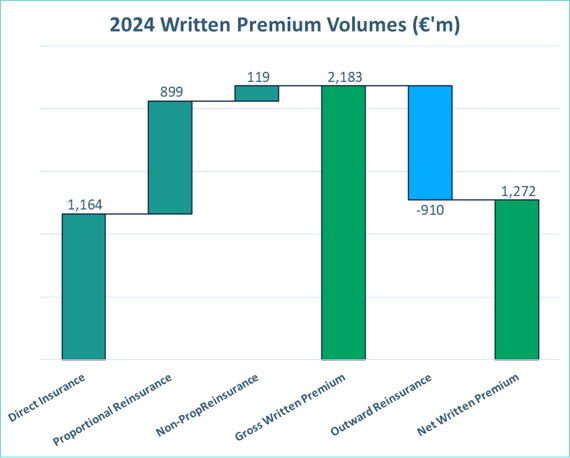
Irish-domiciled captives wrote approximately €2.2bn of premium in 2024, with just over half placed through direct insurance and the remainder via reinsurance. Outward reinsurance absorbed around €0.9bn, leaving €1.3bn of net premium retained.
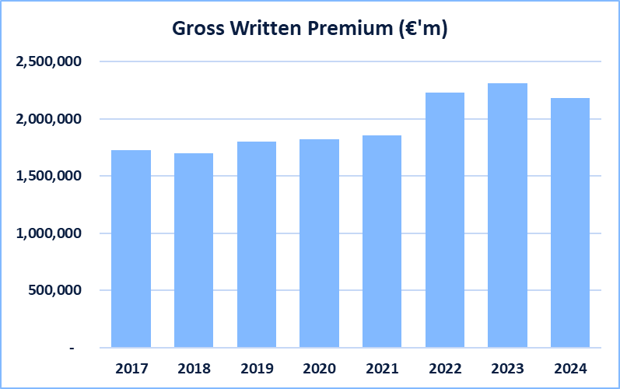
While the number of licensed captives has declined gradually since 2017, economic activity has expanded. Premium volumes grew from €1.7bn in 2017 to over €2.3bn in 2023, before moderating slightly in 2024.
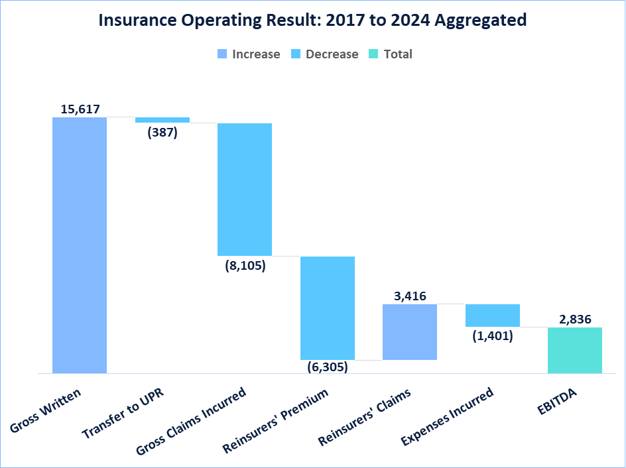
Across 2017–2024, the sector reported:
€15.6bn gross written premium
€15.2bn earned premium
€8.1bn gross incurred claims
€2.9bn net reinsurance costs
€1.4bn operating expenses
This results in €2.8bn of EBITDA, before investment income and tax — equivalent to a 53% gross loss ratio and 63% combined.
Dominant classes
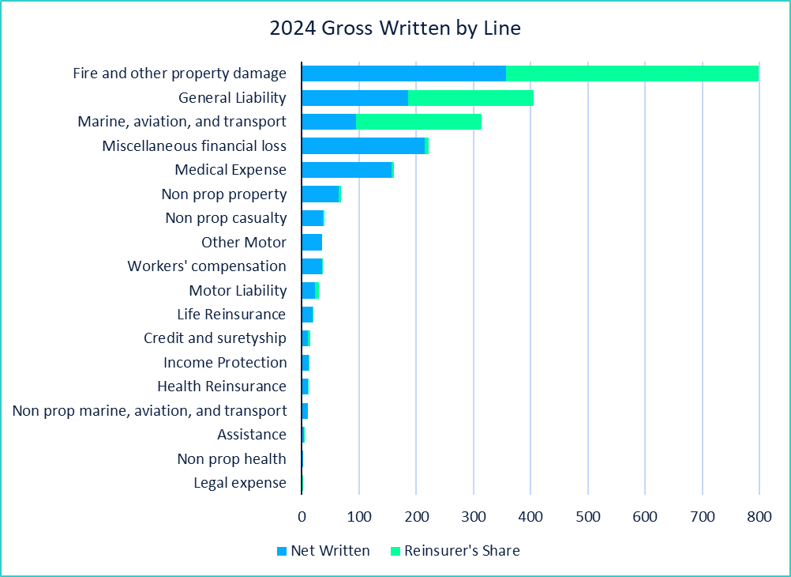
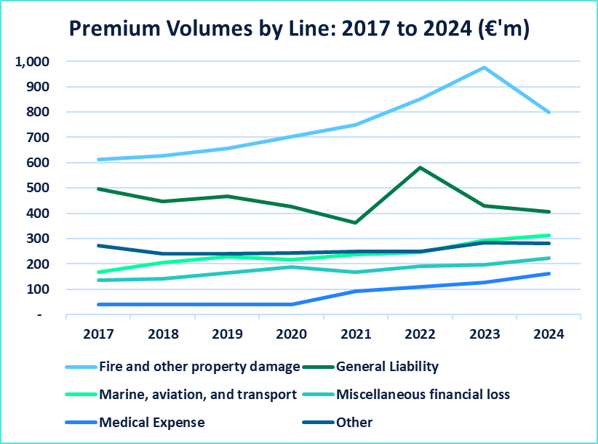
Fire & Other Property Damage remains the largest line of business, generating nearly €800m of premium in 2024. General Liability follows at over €400m, with Marine, Aviation & Transport (MAT) exceeding €300m. Across these core lines, captives cede more than half of gross premium, reflecting a continued emphasis on volatility and capital protection.
Beyond traditional P&C risks, several classes have expanded significantly. Miscellaneous Financial Loss now exceeds €200m, and Medical Expense Protection surpassed €150m in 2024. These lines tend to be retained at higher levels.
Smaller classes collectively account for circa €300m of premium, but the trend is notable: more captive owners are broadening programmes into financial loss, employee benefits and specialised lines.
From a growth perspective, property premiums increased from €600m in 2017 to nearly €1bn in 2023 before easing to €800m in 2024. General Liability has been volatile but with limited growth over the medium-term. MAT, Medical Expense and Miscellaneous Financial Loss have approximately doubled over the past eight years — highlighting a more strategic use of captives beyond traditional property and liability.
Favourable Loss Ratio Experience
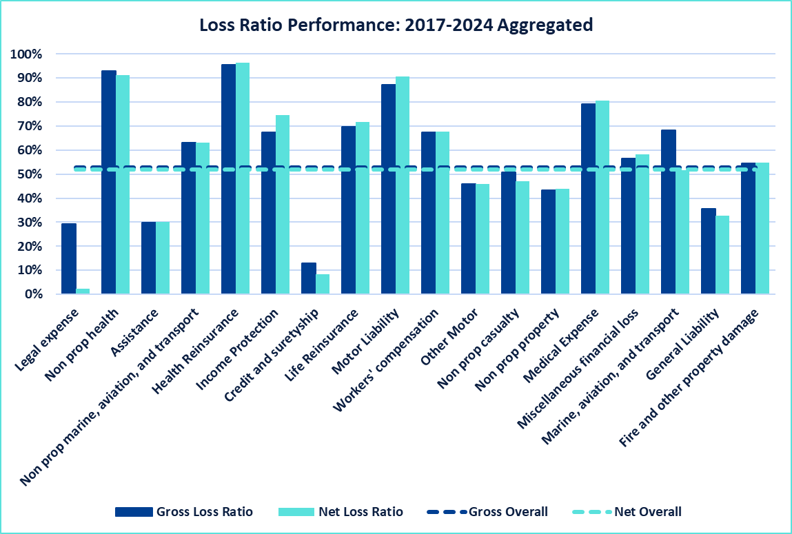
Irish captives have delivered consistently profitable underwriting results. From 2017 to 2024, the sector recorded an average 53% gross and 52% net loss ratio.
Key class-level results include:
Fire & Other Property Damage: 55% gross and net
General Liability: exceptionally strong at 36% gross / 35% net
Other major classes: almost all below 90% gross
Combined with expanding premium volumes, the data shows that captives are widening their risk footprint while maintaining disciplined, stable underwriting performance — even in long-tailed classes.
Reserving profile
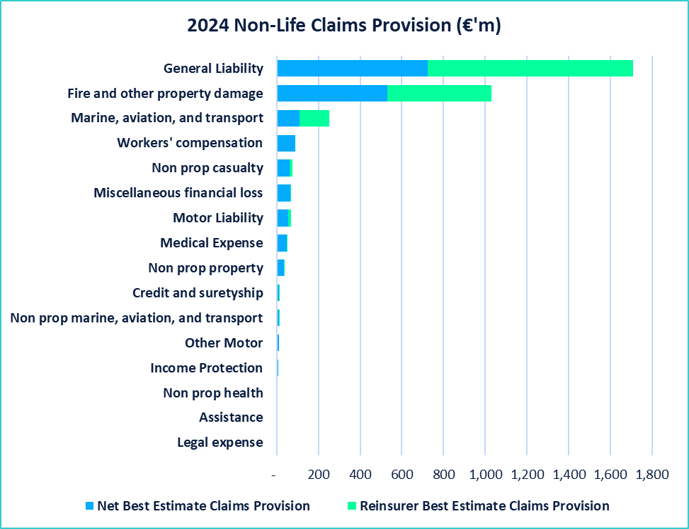
At end-2024, Irish captives held over €3.4bn in gross claims provisions, reducing to under €1.8bn after reinsurance. Despite property dominating premiums, General Liability accounts for the largest share of reserves — around €1.7bn, compared with €1bn for property — reflecting the long-tailed nature of casualty lines.
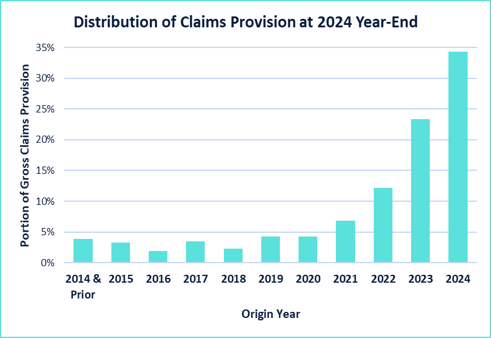
Only one-third of reserves relate to 2024 claims; 4% relate to claims more than ten years old. This maturity profile is a significant driver of reserve risk within the SCR, contributing to the conservative capital buffers many captives maintain.
A persistent challenge is data credibility. Many captives lack sufficient historical depth to produce fully credible best-estimate reserves. This can lead to prudence creeping into best estimates — through unvalidated tail factors, aggregated development patterns, or manual loadings.
Where data is limited, captives should leverage external benchmarks and peer comparisons to produce more accurate best estimates. This strengthens credibility and reduces unnecessary capital strain.
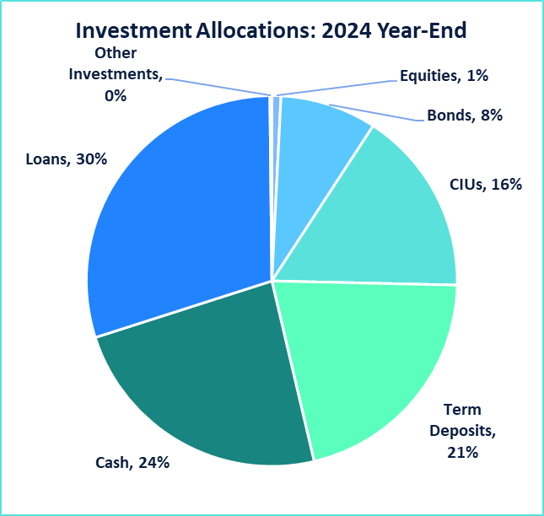
Under-utilised and over-concentrated assets
Investment strategy remains a blind spot for many Irish captives. Portfolios are often concentrated in low-yielding or capital-intensive assets:
30% in intra-group loans
24% in cash and short-term deposits
CIUs are widely used, but often concentrated
Only 8% in bonds and 1% in equities
This cautious profile inflates market risk charges — which account for 44% of the SCR versus 33% for traditional insurers — suppressing return on capital.
More balanced, better-diversified portfolios can reduce SCR charges without increasing risk appetite, improving capital productivity.
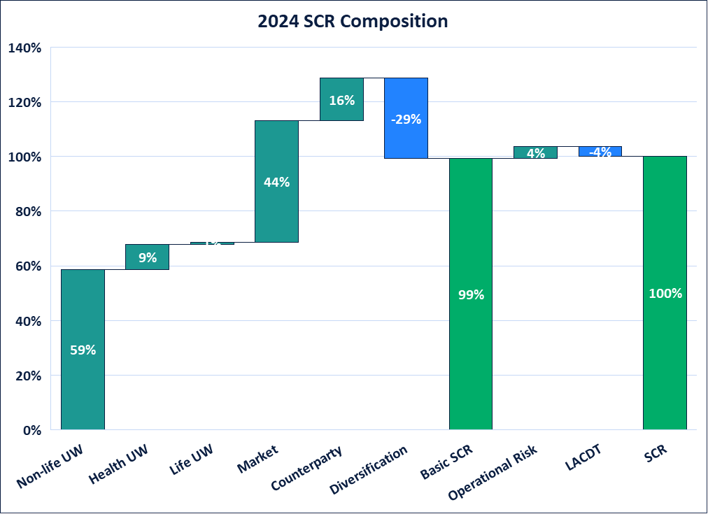
Solvency and capital
At year-end 2024, the aggregated SCR for Irish captives totalled €2.5bn. The composition includes:
59% non-life underwriting risk
44% market risk
16% counterparty default
9% health, 4% operational, 1% life
Offset by 29% diversification and 4% LACDT
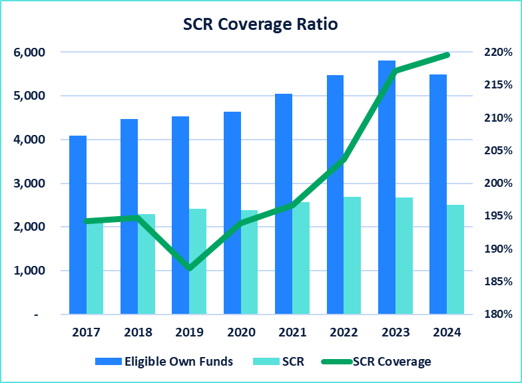
Captives held €5.5bn of eligible Own Funds, equating to a strong 220% SCR coverage ratio. This has risen from 187% in 2019, driven mainly by retained earnings.
However, variation is significant. Most captives fall within 150%–250%, but some operate below 150%. Others hold 4–5 times their SCR. Smaller captives typically operate below €50m SCR, while a handful of multinational groups exceed €100m–€300m.
The uneven distribution — and in many cases excessive capital levels — is a core contributor to weak return on capital.
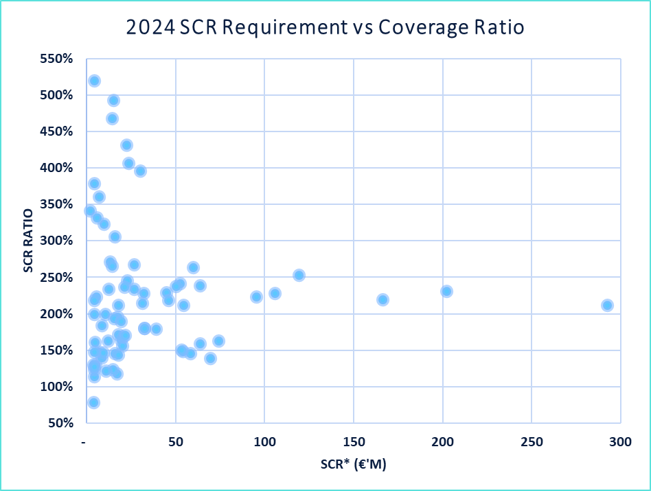
*Note: MCR was used in place of SCR for a select number of captives in the above scatterplot where the MCR values exceeded SCR
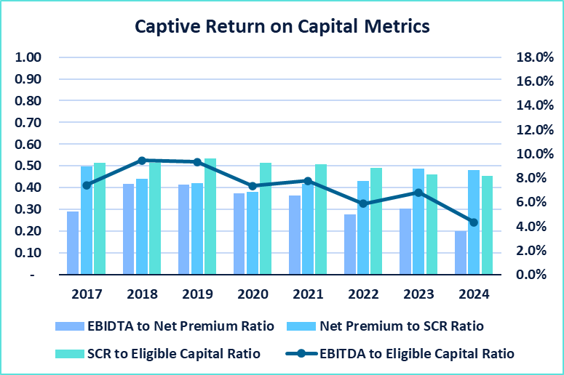
Irish captives generate strong underwriting profits — averaging €355m EBITDA annually — but only a 7.2% return on capital, versus 16.3% for insurers, over the past eight years.
This is not due to underwriting profitability. The gap arises from capital efficiency.
Return on capital can be decomposed into three drivers:
EBITDA / Net Premium = 0.33 - This is comparable to 0.34 for mainstream insurers, indicating captive underwriting profitability is strong
Net Premium / SCR = 0.44 - Captives generate a €100 SCR obligation for every €44 net premium written. This compares to a ratio of 0.86 for traditional insurers.
SCR / Eligible Capital = 0.50 - For every €50 SCR, captives were holding circa €100 total capital. This compares to 0.55 for other insurers.
Multiplying these components yields the observed 7.2% return. Notably, this figure has declined over the past three years.
In short: capital, not underwriting, is the constraint.
Other non-life insurers, in contrast, have proven to be savvier at:
Optimising their net premium to SCR ratio, and
Operating with leaner eligible capital buffers
The result has been consistently strong return on capital.
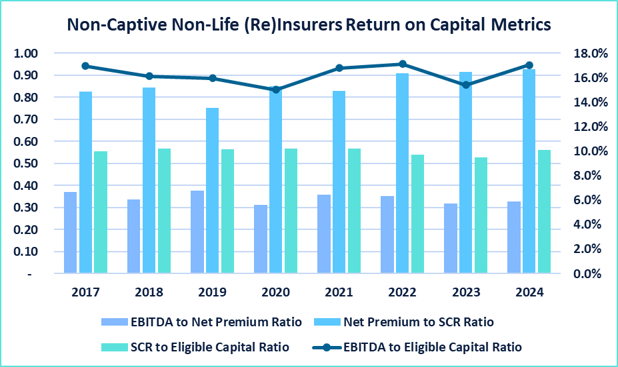
*The comparative data excludes internal model users, ensuring analysis is limited to Standard Formula users only
Key Drivers of Weak Capital Efficiency
Captives match insurers on underwriting but fall short on capital productivity:
Reinsurance is not aligned to SCR drivers: Many programmes smooth volatility, but do not tactically target key capital drivers
Concentrated investment portfolios: Heavy use of intra-group loans, cash, and undiversified assets raises market risk charges.
Under-utilised deferred tax capacity (LACDT): Insurers offset ~8% of SCR; captives only ~4%.
Captives hold more capital than needed: Average coverage of 200% (vs insurers’ 180%) reflects Board conservatism, ORSAs geared toward compliance rather than capital strategy, limited review of surplus capital or dividend planning, and poorly defined risk appetite statements.
Excess capital tied up in reserves: Unsophisticated reserving practices delay release of surplus provisions.
Inflated SCRs + high capital buffers = lower overall capital efficiency.
Ireland’s Strengths and the Path Ahead for Capital-Efficient Captives
Ireland remains one of Europe’s strongest captive domiciles. Its predictable Solvency II environment, deep actuarial talent, and mature insurance ecosystem give captives a solid platform on which to evolve from compliant to optimised operations.
As captives expand into cyber, employee benefits and credit insurance, expectations from captive owners are rising. Strong underwriting is necessary — but capital efficiency is becoming the differentiator:
Reinsurance designed around SCR drivers
Balanced investment strategies
Deferred tax optimisation
A strategic ORSA and clearer risk appetite
More credible reserving frameworks
Deliberate management of surplus capital
The insurance engine is working. The challenge — and opportunity — now lies in capital optimisation.